

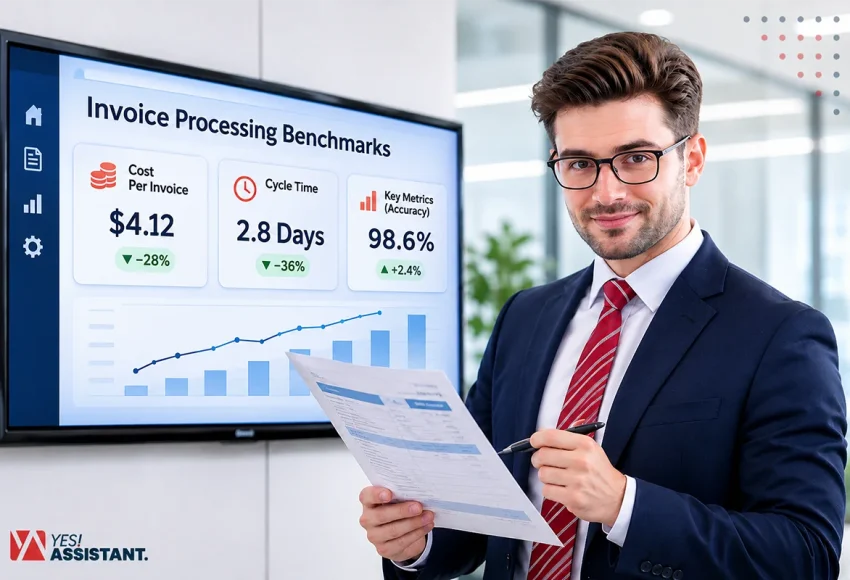
Invoice Processing Benchmarks: Cost, Cycle Time and Key Metrics
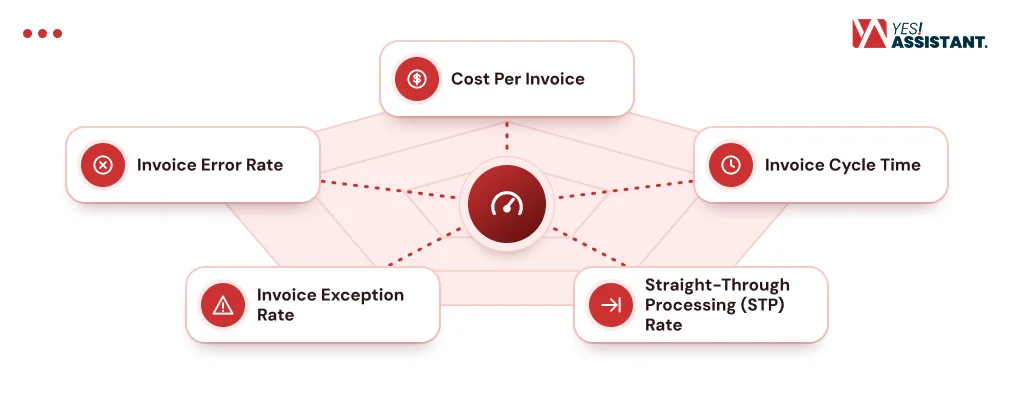
Do you know how efficient your invoice processing is compared to other businesses? Invoice processing benchmarks provide you with an opportunity to understand your efficiency by comparing it with others. Typical performance levels include cost per invoice, invoice cycle time, straight-through processing (STP) rate, invoice exception rate, and error rate, while also showing how efficiently invoice data moves through the process.
For example, the average cost per invoice is about $9.40, compared with $2.78 for best-in-class organizations. Similarly, the average invoice cycle time is about 9.2 days, while best-in-class organizations process invoices in around 3 days.
However, no single benchmark is one-size-fits-all; rather, they differ based on company size, staffing, processing model, benchmark groups, and other related factors. In this guide, we will break down the latest and most reliable figures so you can compare and understand your efficiency.
Key Takeaways
- Invoice processing benchmarks vary by company, process, and benchmark group.
- The average cost per invoice is about $9.40, compared with $2.78 for best-in-class.
- Average invoice cycle time is about 2 days, while best-in-class is around 3 days.
- Best-in-class organizations achieve about 2% STP, compared with 32.6% industry average.
- Use comparable benchmarks to identify AP performance gaps rather than treating them as universal targets.
What Are the Current Invoice Processing Benchmarks?
The current invoice processing in accounts payable benchmarks include cost per invoice and invoice cycle time, straight-through processing rate, invoice exception rate, and Invoice error rate. These benchmarks help businesses identify gaps and take effective steps to improve them. Here are the invoice processing benchmarks.
Cost Per Invoice
Definition: Cost per invoice refers to the cost of processing a single vendor invoice, from invoice capture through payment processing.
Benchmark :
- Industry Average: According to Ardent Partners, the average cost per invoice processed in industry is ~$9.40 per invoice.
- Lowest Market (best-in-class): The lowest cost per invoice is around ~$2.78 per invoice. This amount is achieved by top performers who utilise advanced AI and touchless processes through automated invoice processing.
- Highest Market (Manual): According to Ardnet Partners’ “Accounts Payable Metrics that Matter” report 2025 the range is $15-$40 for manual processing.
Invoice Cycle Time
Definition: Total processing time refers to the total number of days or hours it takes to process an invoice through the accounts payable process, from receipt to completion.
Benchmark:
- Industry Average: According to Ardent Partners, the industry average for businesses that use automation is ~9.2 days.
- Lowest Market (best-in-class): Top performers who leverage a high STP rate take an average of ~2.9 days.
- Highest Market (Non best-in-class): Businesses that face heavy paperwork, manual labor, and missing POs have an average invoice cycle time of ~17.4 days.
Straight Through Processing (STP) Rate
Definition: Invoices that are processed end-to-end from receiving to payment status ready without any human intervention or human touch. This touchless processing rate shows how much of the workflow can run without manual intervention.
Benchmark:
- Industry Average: According to Ardent Partners’ 2025 report, the industry average touchless processing rate is around ~32.6%.
- Highest market (best-in-class): The highest market or best-in-class rate for STP is ~49.2%.
Invoice Exception Rate
Definition: percentage of invoices that fail automation or standard checks, including 2-way or 3-way invoice matching mismatches, missing GL coding, unauthorized pricing, or incorrect purchase order details, and require manual intervention to make the payment ready.
Benchmark:
- Industry Average: Ardent Partners cited that the industry average exception rate is ~18.4%.
- Lowest market (best-in-class): The best-in-class invoice exception rate is ~11.1%.
- Highest market (All Others): For all others, the rate goes up to ~20.9%.
Invoice Error Rate
Definition: Invoice error rate refers to the percentage of invoices that contain incorrect invoice data, discrepancies, missing approvals, and require manual correction before the invoice is payment-ready. Businesses can use accounts payable error reduction practices to address recurring errors.
Benchmark:
- Industry Average: According to Medius Research, the average industry rate is 1%-5%.
- Lowest market (best-in-class): The lowest average invoice error rate is around 8% to 1%.
Benchmarks by Processing Model
The following table compares the published benchmark figures by performance group and processing characteristics. These figures come from different benchmark sources and should not be interpreted as measurements from a single standardized processing-model study.
| Processing Model | Cost per Invoice | Cycle Time | Straight-Through Processing (STP) Rate | Error Rates | Invoice Exception Rate |
| All Others / Higher-Cost Performance Group | $15.00 – $40.00 (Average: ~ $ 19.83) | days (Slowest in the market) | Near 0% (Single digits) | 1% – 5% (or higher for manual work) | Up to 20.9% (All Others / High exception group) |
| Industry Average | ~9.40$ (Industry average) | days (Industry average) | ~32.6% – 35.4% | 1% – 5% (Industry Average) | 18.4% (Industry Average Exception Rate) |
| Best-in-Class Performance | ~$2.78$ | days | 49.2% – 51.0% (Up to 70% – 90% optimal) | 0.8% – 1% (Best-in-Class Error Rate) | 11.1% (Best-in-Class Exception Rate) |
Why Do Published Benchmarks Disagree?
Published benchmarks disagree because they are not tested under the same terms. Even reports from the same research organizations can be different because they use different samples, definitions, and comparison groups.
Overall Average vs. the All Others Group
| Benchmark Group | Average Invoice Processing Cost | What the Group Represents |
| Best-in-Class | ~$2.78 per invoice | The top 20% of enterprises with the lowest average invoice processing costs and shortest processing cycle times. |
| Overall Average | ~$9.40 per invoice | A combined figure that includes both high-performing and lower-performing organizations. |
| All Others | ~$12.88 per invoice | Organizations outside the Best-in-Class group. |
The 2025 Edition vs the 2026 Edition
| Factor | 2025 Edition | 2026 Edition |
| Research period | Based on data available for the 2025 edition | Based on newer research and data |
| Benchmark figures | May report figures such as $9.40 per invoice | May show different figures based on newer data |
| Comparison criteria | Based on the methodology used for the 2025 edition | May use updated criteria or methodology |
| Why results can differ | Reflects conditions and data available at the time | Reflects more recent market conditions and research |
Sample Size and Company Mix
Sample size and company mix are a big reason why benchmark results often come out different. Some surveys are done on 10-12 enterprises from the same city; on the other hand, some surveys might include 50 enterprises from the entire country. For example, the Ardent Partners’ 2025 State of ePayables study included 204 respondents.
Among these organizations, 54% had annual revenue above $1 billion, 26% had revenue between $250 million and $1 billion, and 20% had revenue below $250 million. The respondents represented 58% North America, 31% EMEA, and 11% APAC while no other survey represents more than 12% of respondents.
In this survey of 204 respondents and their organizations, some had a higher level of automation included that helped them keep costs down. Some went through problems that might have caused their expenses to inflate. And the data that is available here is a mix of all these companies. For that reason, the combined numbers can be different from surveys from other research organizations, which is pretty normal.
How Do You Compare Your Own Numbers?
To compare your own numbers, compare your invoice processing KPIs with the benchmark that uses the same metric definition, processing model, and a reasonably similar company or benchmark group. Also keep an eye on whether the benchmark represents a manual, mixed use of artificial intelligence or highly automated process.
Here is a detailed insight about how you can compare your own numbers:
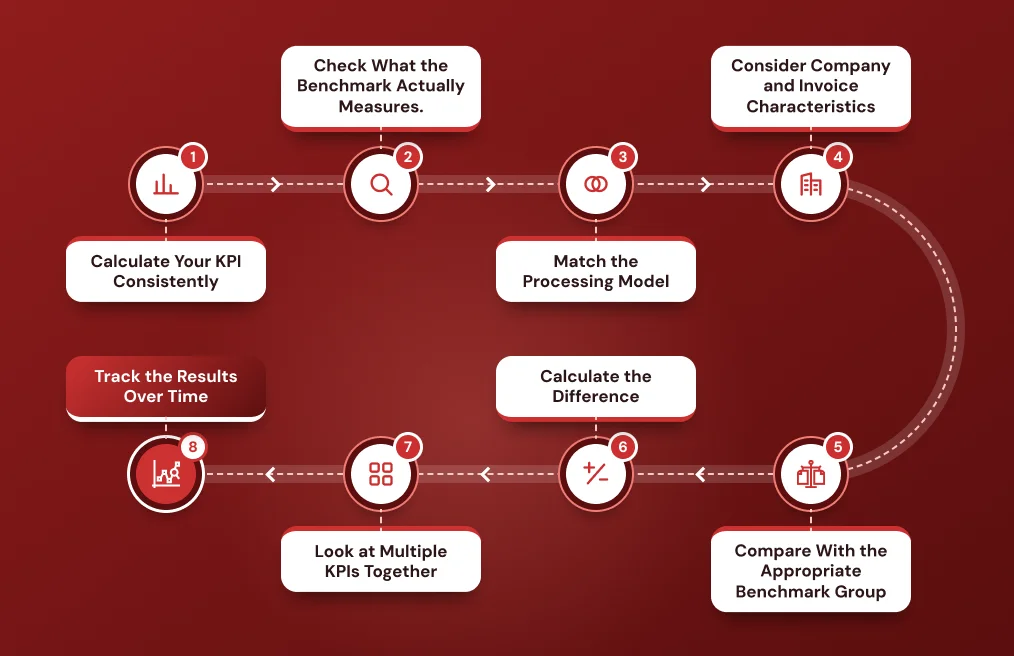
1. Calculate Your KPI Consistently
Always use a consistent formula and measurement to calculate your KPIs consistently.
2. Check What the Benchmark Actually Measures
Check the benchmark’s definition, formula, reporting period and included costs or activities. Keeping these factors in mind will prevent you from comparing with different measurements that carry the same KPI name.
3. Match the Processing Model
Make sure to compare with the same business model, such as manual. Partially manual and highly automated. Because different processing models bring different results and comparing your numbers with the wrong processing model will provide a wrong insight.
4. Consider Company and Invoice Characteristics
Factors like invoice volume, company size, staffing, and invoice complexity can all have an impact on the comparison process. For example, small AP teams working with manual data entry cannot be expected to match the results of a highly automated large enterprise, especially when they manage different accounts payable and accounts receivable processes.
5. Compare With the Appropriate Benchmark Group
Compare your number with the appropriate benchmark group so AP teams can understand the current status of their performance. For example, if your number is similar to the best-in-class benchmark numbers, it means your numbers are better than the majority.
6. Calculate the Difference
Calculate the difference between your numbers and the industry benchmark. It helps you understand if your number is higher or lower than the number you want to achieve. For example, if your cost per invoice is $12, and your comparable benchmark is $9.40, your cost per invoice is $2.60 higher.
7. Look at Multiple KPIs Together
Do not compare your numbers to only one KPI; instead, compare it with multiple KPIs for better understanding. Having a lower processing cost does not necessarily mean the process is efficient if invoice processing time or exception rates remain high.
8. Track the Results Over Time
Tracking results over time is crucial for understanding whether your numbers are changing and identifying ways to improve accounts payable efficiency while protecting cash flow. It will help you take effective action to improve the numbers you want to achieve. Also you will understand if you should move to automation, or whether manual or partial automation is the best choice for your needs.
Applying the Benchmarks to a Small Finance Team
Applying benchmarks to small finance teams can be proven effective. Small finance teams should use benchmarks as reference points rather than trying to achieve the exact number. Because a benchmark that came from a large company may not be the best choice for a small finance team.
This happens because invoice volume, staffing, automation levels and other related factors can differ. For teams that lack the resources to manage the process internally, an invoice processing service can also handle routine processing and help maintain consistent performance.
Methodology
Benchmark comparisons are very sensitive and crucial, and we left no scope of negligence in this matter. We compared the numbers in this guide with AP benchmark reports that provide measurable data.
For every single benchmark, we had a keen eye for the source, year of publication, metrics, benchmark group, and the number of people or organizations surveyed. Multiple reports stated different figures but rather than flagging that as an error, we included the most reliable figures.
Conclusion
The benchmark figures shown in this guide prove that invoice processing can vary between organizations and processing models. Organisations with the lowest average invoice processing costs and shortest average invoice processing cycle times make up the Best-in-Class group in the cited Ardent Partners benchmark.
Use the above-mentioned figures as reference points for evaluating your AP process, not as universal targets. To improve your invoice processing operations, first establish a KPI baseline, compare it with the most relevant benchmarks, identify gaps, and reduce manual invoice processing where it affects cash flow or Total processing time. Tracking these metrics will give you a clear outline of whether your invoice processing is becoming faster, cost-effective, highly automated or the vice versa.
Frequently Asked Questions
What is a good touchless invoice processing rate?
A good STP or touchless invoice processing rate is around ~49.2%, which is considered best-in-class according to the benchmark reported by Ardent Partners. And the industry average for STP is around ~32.6%.
How much does it cost to process one invoice?
The industry average cost to process one invoice is around ~$9.40 and the best-in-class benchmark is about ~$2.78.
How many days does invoice processing take?
The best-in-class Total processing time is about ~3.1 days, while the industry average invoice processing time is approximately ~9.2 days.
What is a normal exception rate in accounts payable?
The industry average exception rate is about ~18.4%, while the best-in-class is about 11.1%. The All Others rate is approximately 20.9%.
What does Best-in-Class mean in AP benchmarks?
The best-in-class group in AP benchmarks refers to the top-performing results based on the measurement.